
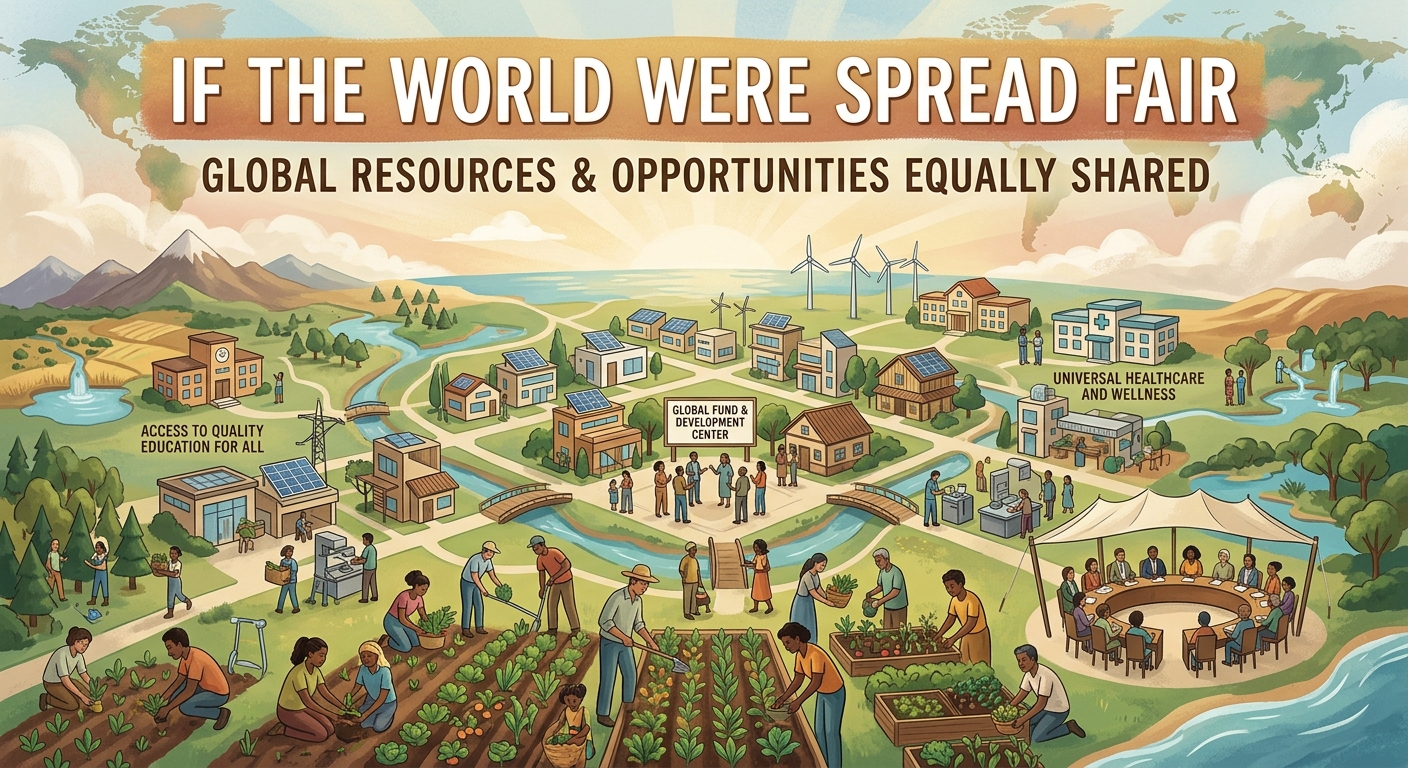
If the World Were Spread Fair
Eight billion people, unevenly stacked on an uneven planet. A reference guide for policymakers, professionals, students and general readers, with data for all 193 sovereign states.
About 8.2 billion of us share roughly 136 million km² of land outside Antarctica. Averaged out, that is about 60 people per square kilometre. Nobody lives at the average: Asia packs in around 110 per km², while Oceania has about 5. Let’s run the numbers on a world that ignored borders, first by land and water, then with two richer “capacity” models.
1. Lens one: land
Share of world population vs. share of land
Asia holds nearly three in five people on a third of the land. The Americas and Oceania are the mirror image: about 13% of people on 37% of the land.
A village of 100 people: today vs. spread by land
2. The census line
World population, 1900 to 2100
Humanity roughly quintupled in a century. The line is flattening, so the redistribution question is about where people live, not only how many.
3. Lens two: water
Water fairness ratio: share of freshwater ÷ share of people
Asia and Africa, home to 78% of people, hold about 37% of renewable freshwater. South America has nearly five times its “fair” share.
4. Three worlds compared
Population by continent, billions
Spread by land alone, Asia would shrink from 4.9 to 2.7 billion, and the Americas would gain about 1.5 billion. Oceania would grow tenfold. Add water and the shifts soften: South America ends up the most crowded of the “gaining” continents.
5. What it means for countries
Population at the world-average density (60 / km²)
Bangladesh would hold about 9 million people instead of 175 million, and Canada would hold 600 million. That gap is what the thought experiment makes visible.
6. Country explorer: all 193 nations
Every sovereign state with World Bank population data is here. “Land-fair population” is what each country would hold if everyone lived at the world-average density. Click a column heading to sort. Filter by region or search by name.
Most crowded and most spacious
7. Beyond land: two richer models
Land area is a blunt tool: a desert and a river delta count the same. A better thought experiment scores each country’s capacity from several ingredients, then shares the same 8.3 billion people in proportion to the score. Two designs are worth comparing.
Model A: resource-adjusted population
Model B: capacity and well-being index
Model B adds a congestion penalty: beyond a country’s productive “sweet spot” of density, each extra person counts for less. Without it, a rich, safe, productive city-state such as Singapore would be handed an absurd share of humanity. The total also stays fixed: if one country gains 50 million people, they must come from somewhere else.
Expected direction of change vs. today
Gain people: RussiaCanadaUSABrazilArgentinaDR CongoKazakhstanSouth AfricaAustralia (water-limited)
Lose people: IndiaPakistanChinaIndonesiaPhilippinesJapanGermanyUKNetherlandsBangladesh (smaller cut)
Paradoxes: Saudi Arabia: energy-rich, water- and climate-poorSingapore: highly productive, heavily penalised for density
Read this carefully. These are directional expectations, not calculated results. This article does not contain a country-by-country calculation. A full 195-country version would need bulk data from the World Bank, FAO AQUASTAT, USGS, UNDP and the World Happiness Report, and the weights above are assumptions, not established science.
The Bangladesh case
Under the land-only model, Bangladesh falls from about 175 million people to roughly 9 million. That number is misleading. The country sits on one of the world’s most fertile deltas, with enormous river systems and highly productive farmland. Once farmland, water and climate are scored, its allocation rises well above the crude figure.
But the space problem remains. At about 1,200 people per km², Bangladesh would still face a heavy density penalty in Model B. The lesson is not that Bangladesh has “too many people.” Its land is exceptionally productive per km², but there is not enough of it for everyone to also enjoy high safety, environmental quality and living standards.
Reality check
Land isn’t equal. Deserts, ice and mountains make much of Canada, Russia and Australia hard to live in. About 71% of land is habitable, and far less is arable.
Density isn’t destiny. Singapore, the Netherlands and Bangladesh’s cities show that productivity, trade and institutions matter more than acreage.
People move through markets. Trade, remittances, migration and technology already redistribute what land and water can’t. The real question is how fairly those flows work, not how to move eight billion people.
Guides by audience
Policymakers and planners
Use the actual ÷ land-fair ratio and density as a first screen for land, food and water planning, not as a target. Then add urban share, water stress, farmland per person and productivity before drawing conclusions. Compare peers with similar geography, for example delta nations or arid resource exporters.
Professionals and researchers
The land-fair model is Popᵢ = P × Aᵢ / ΣA. The capacity models replace area with a weighted index, Sᵢ = Σ wₖ·xᵢₖ (each indicator normalised), then Popᵢ = P × Sᵢ / ΣS, with an optional congestion penalty. Run sensitivity tests on the weights; the results change materially.
Students and teachers
Try this: (1) recompute density for five countries; (2) rebuild the explorer table in a spreadsheet; (3) change one weight in Model A and see who gains; (4) explain why the Netherlands and Bangladesh function at high density; (5) list three assumptions that could be wrong.
General readers: three takeaways
1) People are spread very unevenly compared with land. 2) Land is only one input; water, farmland, climate and institutions matter as much. 3) This is a thinking tool, not a plan to move anyone.
Method, limits and glossary
Explorer data. 193 sovereign states with World Bank 2024 population estimates and country area from an open country dataset. Vatican City (no population series), Taiwan, and dependent territories are not included. Regions follow the dataset’s five-region scheme, so Russia is counted in Europe there. Charts earlier in the article use rounded continental estimates for 2025, so their totals differ slightly from the explorer.
Not a carrying capacity. Nothing here says how many people a country can support. Total area includes lakes and uninhabitable land, and the capacity models in section 7 are described but not calculated country by country.
Glossary
Density: people per km². Land-fair population: area × world-average density. Actual ÷ land-fair: a country’s population divided by that figure. Carrying capacity: people an environment can sustain, which depends on technology and trade. Congestion penalty: a rule that lowers each extra person’s weight above a density threshold. Water fairness ratio: share of freshwater divided by share of population.
FAQ
Is this a proposal to move people?
No. It is a thought experiment that makes inequality of land and resources visible.
Does high density mean a country is poor or failing?
No. Singapore, the Netherlands and Japan are dense and wealthy. Productivity, trade and institutions matter more.
Why use total area, not land area?
It is available consistently for every country. Land-only or arable-only versions would shift some results, especially for lake-rich countries.
How should I cite this?
The Paper (2026), “If the World Were Spread Fair: a global reference”, with data from the World Bank and the open country datasets listed below.
Sources: UN World Population Prospects 2024; UN Statistics Division; FAO AQUASTAT; national statistics. Country data: World Bank population (2024) via the open datasets/population repository; country areas from the open mledoze/countries dataset. Suggested inputs for the capacity models: World Bank indicators, UNDP Human Development Index, USGS Mineral Commodity Summaries, World Happiness Report. Figures are rounded approximations for illustration. Central America and the Caribbean are grouped with North America.